On BCH Bull, fully collateralized, non-custodial, permissionless leverage and stabilization contracts are surprisingly simple to set up. Every contract comes down to the same sequence of logical decisions: whether to long, short or hedge, which asset, how much you are committing, for how long, and how much leverage you wish to carry.
With this new contract creation visualization update, none of that fundamental flow has changed. The page however has had a structural tidy-up, with the contract creation form split into four numbered cards and a dynamic fee estimator that follows you down the page.
But more interestingly, sitting in the middle of it is something genuinely new: an interactive Contract Diagram, with your liquidation price and take profit price as clickable markers you can drag along a price bar. The Contract Diagram also has a dynamically calculated break even price, taking into consideration any fees you may pay or receive to make the contract.
With this new diagram, your positions for liquidation and automated profit taking are now something you can easily see, rather than something you previously worked out through a leverage slider. As a consequence, the full active price range of your position is now very easy to appreciate and understand.
Four cards, in the order you decide things
Contract creation used to be one long form. It is now four numbered cards, in the order the decisions actually happen: asset and amount, duration, leverage, payout. Reading top to bottom just makes more sense now.
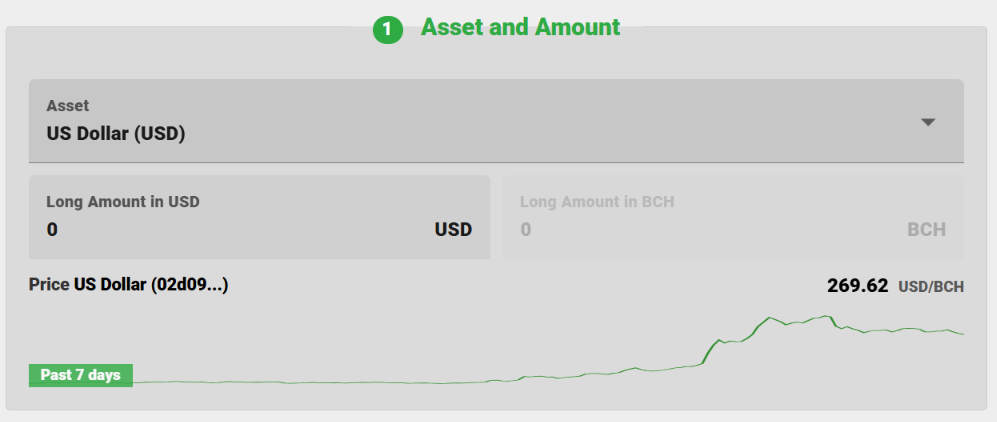
Step 1. Asset and Amount
Pick the asset, then type your amount either in that asset or in BCH. Fill either field and the other fills itself from the live oracle price. Below that sits the current oracle price and a seven day chart, which is enough to check where the market has been before you commit to anything.
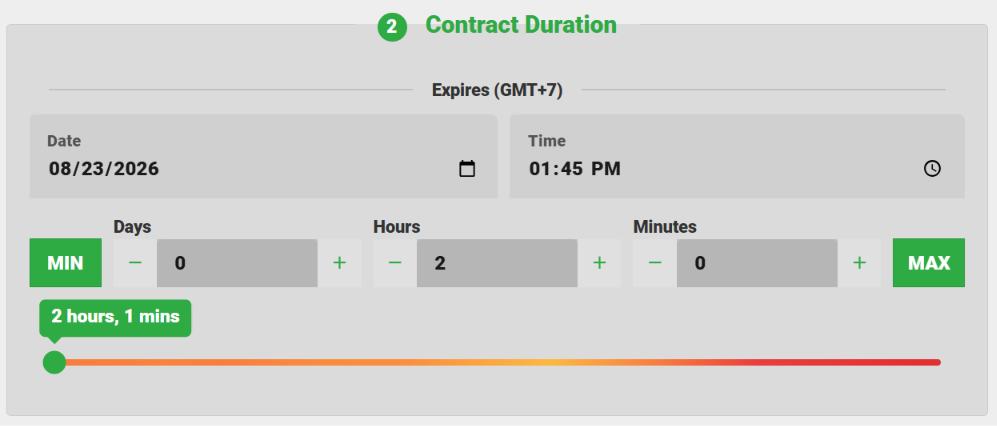
Step 2. Contract Duration
Set the expiry with the date and time fields, or count in days, hours and minutes using the steppers. MIN and MAX jump straight to the shortest and longest contracts available, and the slider under them covers everything in between.
The slider itself is a colored scale rather than a plain track, so you can see at a glance which contract lengths are currently attracting better premiums. If you want the full picture before you settle on a duration, the premiums page tracks them across every asset and length.
Step 3. Leverage Options and the Contract Diagram
This is where the most exciting update is. The leverage sliders are still there, but sitting above them is the Contract Diagram, which shows the full range of prices your contract will be active in, with red and green zones marking loss and profit.
More excitingly, you can clearly visualize how your own leverage moves your liquidation threshold, and how the counterparty leverage moves your take profit price. You can also interact with the diagram directly, dragging the markers to set your positions using price points rather than leverage.
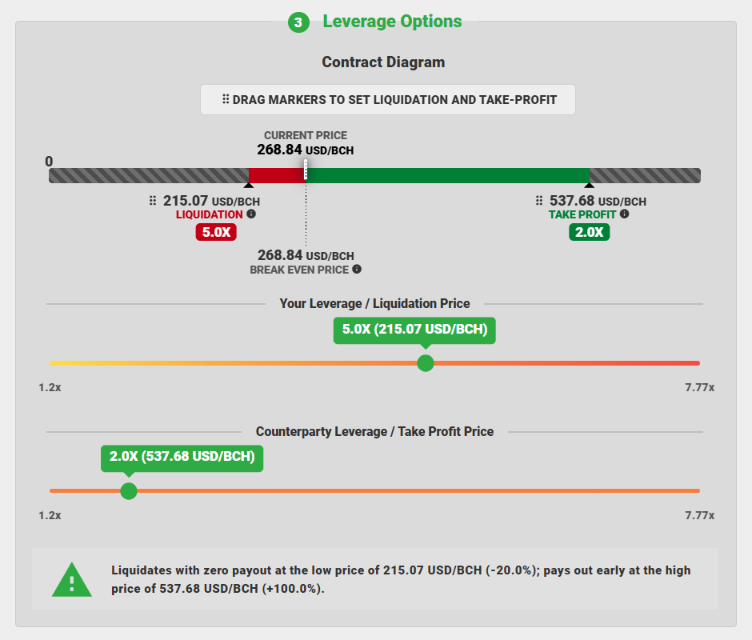
The bar is price. It runs from zero on the left, upward to the right.
- The white marker is the current price, with a dotted line under it.
- The colored stretch either side of it is the range your contract is active in.
- The hatched grey ends are beyond that range. Price can go there, but your contract has already settled by then.
- Break even sits a little away from the current price, because it includes the fees. That is what the market has to reach for you to break even.
The colors tell you which way is which. On a long, red is on the left, running down to your liquidation price, and green is on the right, running up to your take profit. On a short they swap over, because a rising price is what works against you. On a hedge the whole bar is blue, since your position holds a steady value in your chosen asset and neither direction is a win or a loss.
Every marker carries its price, its label and a leverage badge, so you never have to work out which multiplier produced which price.
Dragging the markers
If you are long, the red marker sits to the left of the current price. If you are short, it sits to the right. Either way, grabbing it sets your liquidation price, and with it your leverage.
Pull it toward the current price and your leverage climbs, with your liquidation point ending up much closer to the current market. Drag it away and you have more room to go before you potentially liquidate, at the cost of taking on less leverage. That trade-off has always been there. Now you can watch it move.
On the other side, the green marker, which is on the right in a long contract and on the left in a short, sets your take profit price. It behaves the same way, except it runs off the counterparty's leverage rather than your own.
Pull it toward the current price and the counterparty leverage climbs, giving you a nearer ceiling the market has a realistic chance of reaching. Push it away and that ceiling moves further out, leaving more upside on the table if the move keeps going, but a smaller chance of ever getting there.
Both leverage sliders are still directly underneath, exactly where they were, with similar color indicators to help you find the best premiums. They are the same two values the markers are, and they stay in step: move a marker and the slider follows, move a slider and the marker follows. If you think in multipliers, use the sliders. If you think in prices, use the diagram.
Under both of them a written summary spells the whole thing out in words: the low price at which the contract liquidates with zero payout, the high price at which it pays out early, and how far each one sits from the current market. Nothing left to interpretation before you propose.
Fees that follow you down the page
Fees used to be something you went looking for. The estimator now stays on screen while you scroll, showing total estimated fees for the contract as it currently stands, in your asset, in BCH, and as a highlighted percentage.
It is live. Change the amount, drag the duration, move either marker, and the figure moves with you. Seeing what a decision costs while you are still making it is a great deal more useful than finding out once you have proposed.

Step 4. Payout
The last card is where the funds land, premiums included. Enter your payout address, add a memo if it helps you keep contracts straight, and tick the box to save that address as your default for future contracts, premiums and refunds.
The warnings have not changed and still deserve attention. Do not use an exchange deposit address. You can change your payout address whenever you like, but only future contracts pick it up, because the payout address on an established contract cannot be modified. Memos are stored in your browser and nowhere else.
Why it matters
A leverage multiplier is an abstraction. 5X tells you nothing about where the price actually has to go. A marker sitting 20 percent below the current price, with a green stretch reaching to double it, tells you exactly that, and you can move it with your finger.
Underneath, nothing about AnyHedge has changed. What you end up with is the same fully collateralized, non-custodial contract it always was. You just get to see the shape of it first.